
Norway's Record Salmon Supply Isn't Cooling Prices the Way It Used To
Real-time vessel tracking shows Norway's weekly harvest topping out in late June, and the price, for once, climbing straight through it.
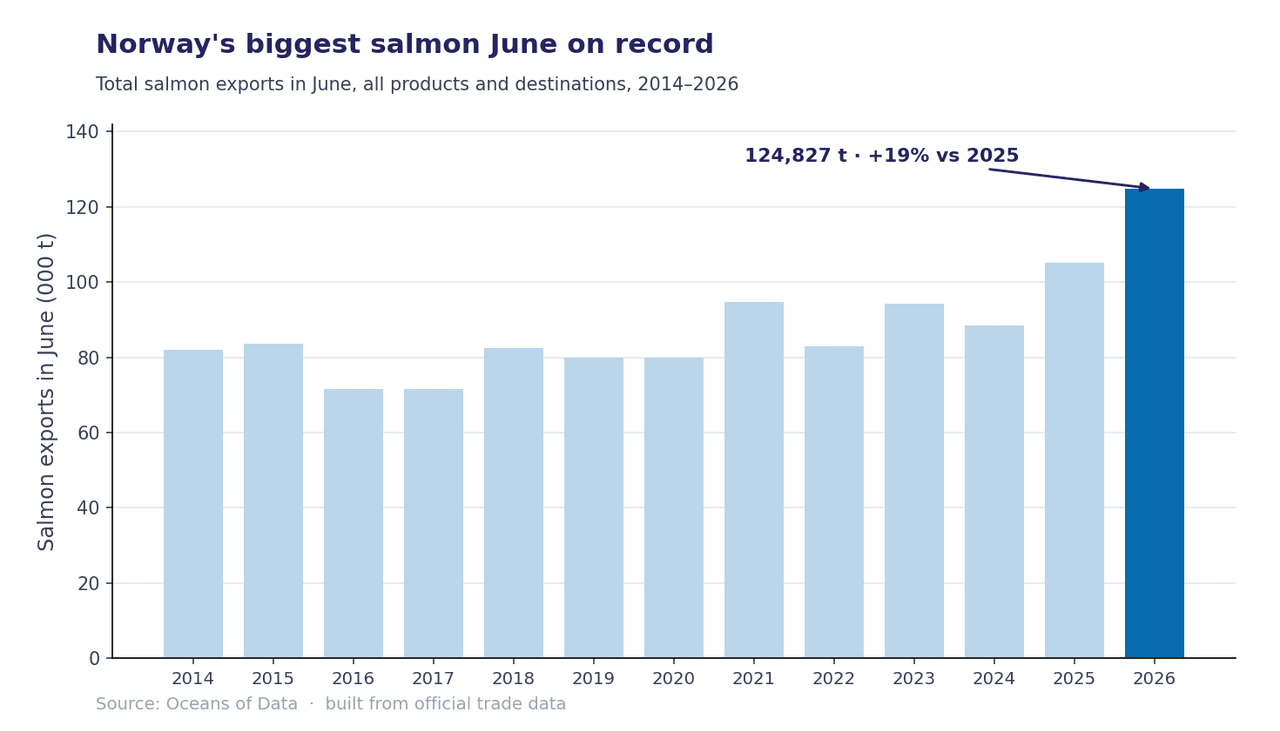
Norway exported 124,827 tonnes of salmon in June, the most for the month in more than a decade of records, and nearly a fifth more than a year earlier. The price went up anyway, and the boats saw it coming before the export data did.
That's the tension worth sitting with. The salmon market spends all summer arguing about price and almost none of it watching the thing that moves first: supply, forming in real time out on the water. The price is the last number to arrive. By the time Norway's weekly export figure is published, the fish it describes were harvested, packed and on their way to market days earlier: the number confirms the past, it doesn't call the turn.
This year, something else did.
The supply signal, in real time
Oceans of Data tracks wellboat movements across Norway's production regions in real time: every stop at every farm site, week by week. It is the earliest honest read of what is actually being harvested, because a wellboat calls at a site before that fish becomes an export statistic. Call it the live-carrier signal.
The live-carrier signal shows harvesting activity peaking in week 26, then easing about 14% through week 28: fewer stops, fewer fish moving toward the plants.
The confirmed export figures, which land a beat later, show the same shape. In Oceans of Data's numbers, export volume topped out that same week, 31,652 tonnes, before easing to 31,235 and then 30,356 tonnes across weeks 27 and 28. Two independent instruments, live vessel movements and official trade data, reading the supply side the same way.
The price is where they part company. Instead of sliding the way a record-supply summer usually forces it to, Norway's weekly export price did the opposite. Export data shows it bottoming in week 26, the very week supply peaked, then climbing: 6.86, then 6.97, then 7.23 EUR/kg, up 12.1% on the same week a year earlier. (That is the realised, value-weighted export price, not the Fish Pool spot figure quoted elsewhere; the two measure different things.)
Supply and price turned in the same week, week 26. The difference is in the timing of the proof: the live-carrier signal showed the supply turn as it happened, while the official figures confirming it printed a week later. That gap, real time versus the official record, is the whole story.
Why this summer is different
A summer price rise sounds unremarkable until you set it against the last two. Line up the same three late-June weeks, year on year, in Norwegian export data:
- 2024: 8.11 → 7.76 → 7.86 EUR/kg
- 2025: 6.86 → 6.83 → 6.45, falling
- 2026: 6.86 → 6.97 → 7.23, rising
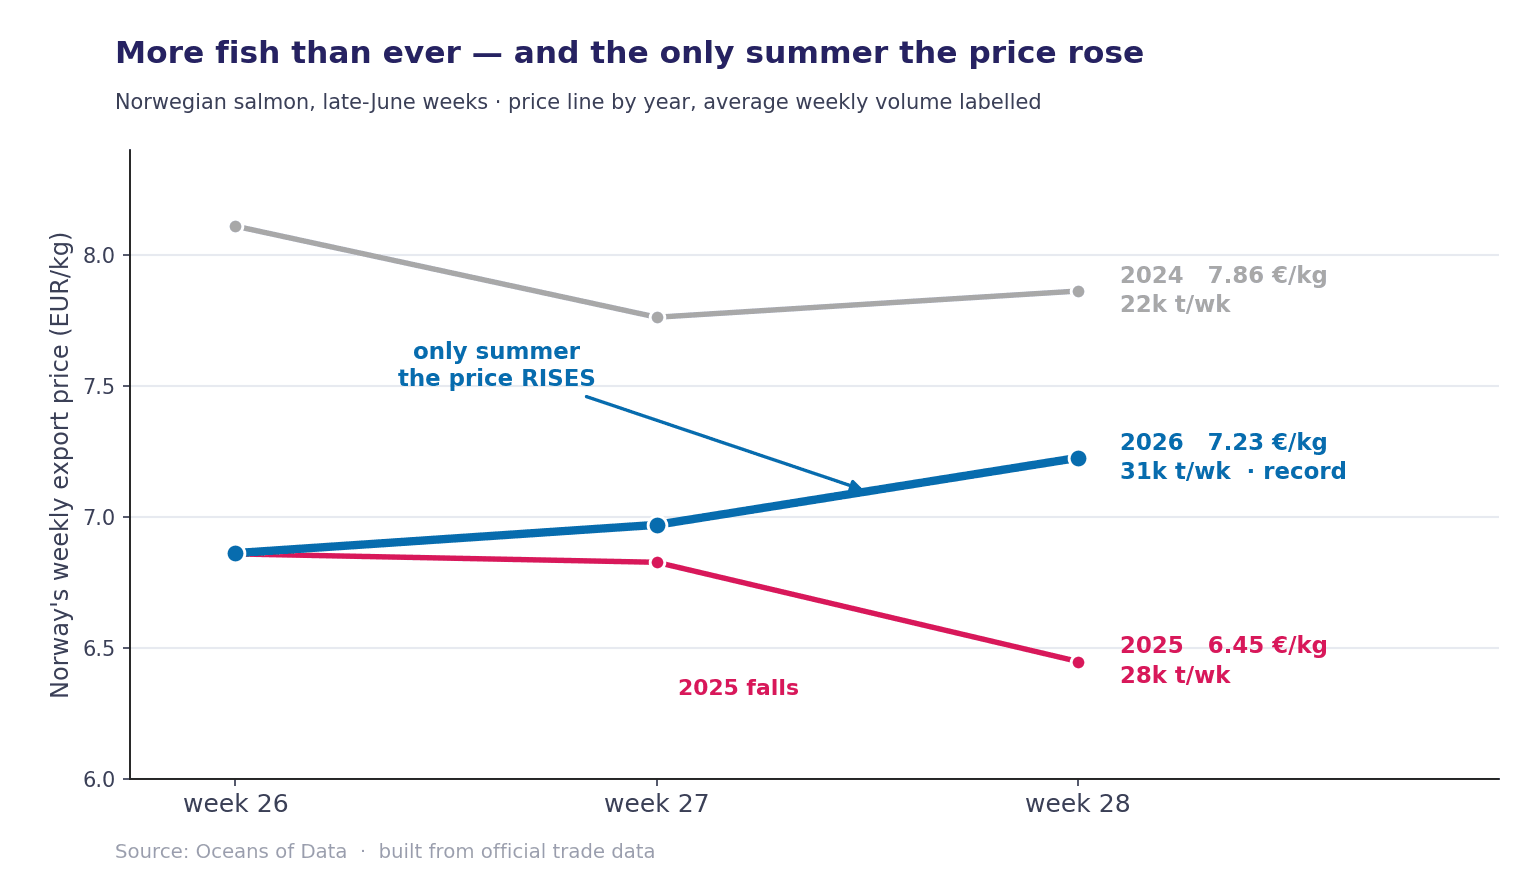
Norwegian salmon export price across the three late-June weeks. 2026 is the only year the price rises through the window, and it does so at record weekly volume (~31k tonnes).
2026 is the only one of the three summers where the price climbs through this window, and it does so while Norway ships its heaviest summer volume of the three, roughly 31,000 tonnes a week against about 27,500 in 2025 and 22,000 in 2024.
More fish than either of the last two summers, and the only rising price of the three. The live-carrier signal points to why: in 2025, wellboat activity was still climbing into week 28 while the price fell to 6.45. This year the activity turned down in week 26, and the price turned up in the same week. Same season, opposite signal, opposite outcome.
What this is, and what it isn't
Be precise about the claim, because it is narrower than the headline. This is not a price forecast. Forecasting is its own discipline. This is something simpler and, right now, more immediate: an observation, and a hard one to argue with. Supply and price both turned in week 26, and the live-carrier signal showed that supply turn as it happened, a week before the official figures confirming it went to print.
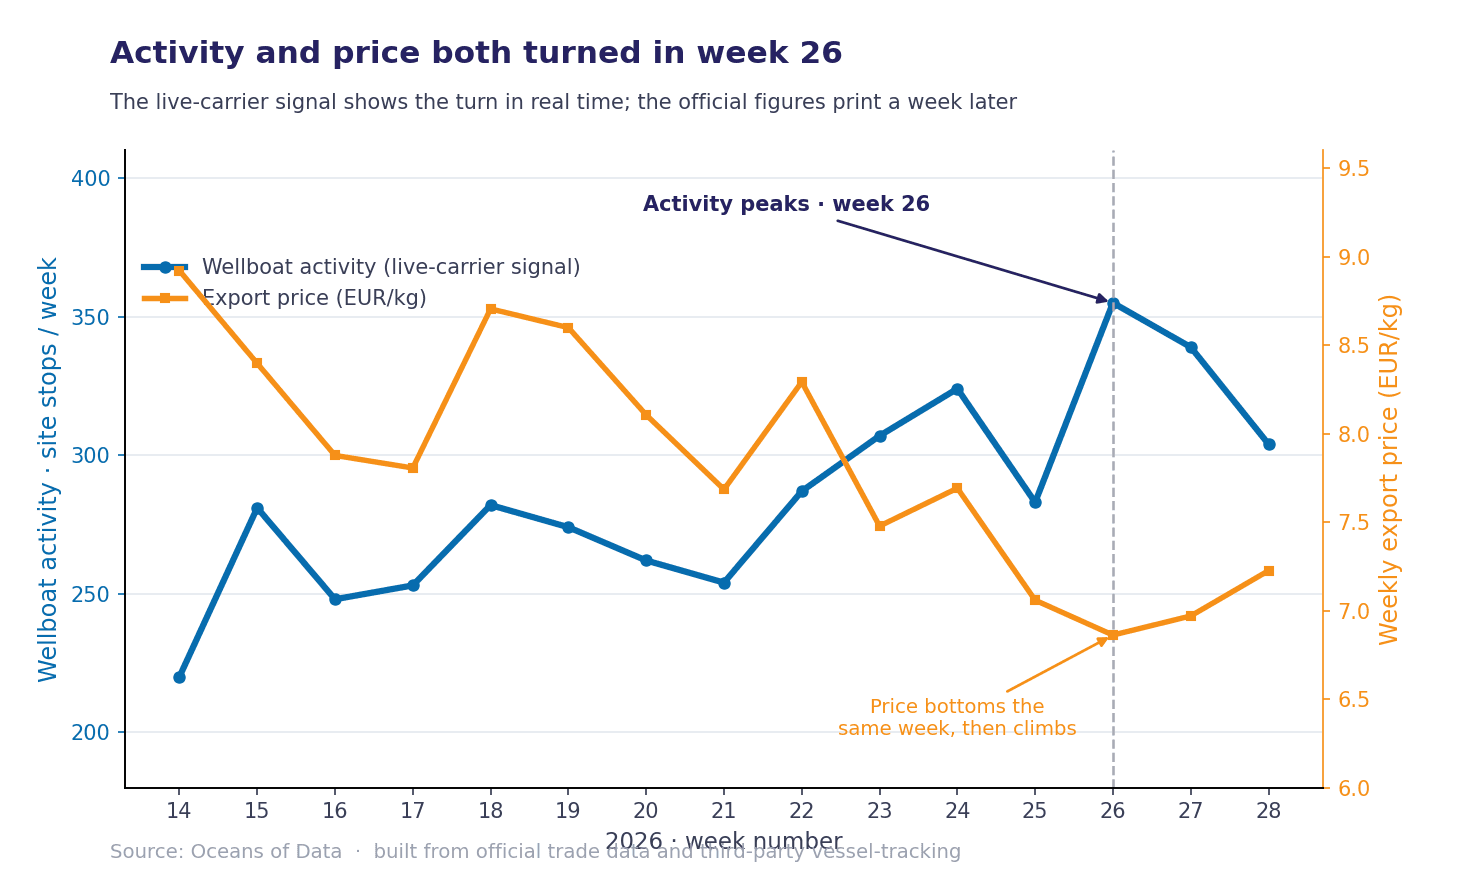
Wellboat activity and the export price both turned in week 26. The live-carrier signal shows the turn in real time; the official figures for that week print about a week later.
None of this proves the wellboats moved the price. A price is never only about volume; product mix, contracts and currency all pull on it, and any trader will tell you so. But the timing is hard to wave away: the supply turn was visible in real time, a week before the official numbers confirmed it.
Nor does it mean the summer peak is behind us. Plenty of fish is still in the water, and the seasonal trough may yet arrive. The point is more useful than a forecast: if you are deciding what to bid this week, when to sell, or how hard to hold a price, then the number that matters is not where the price closed on Monday. It is what the boats were doing on Monday. That is next week's price, already in motion.
Everyone watches the export number. The number is the echo. By the time the official figure confirms the turn, the live-carrier signal has already shown it, a week earlier.
A note on the numbers. All figures are Oceans of Data's own, built from official trade data and third-party vessel-tracking. Prices are realised export values, not the Fish Pool spot price.
Anna Björk Theodórsdóttir
Founder & CEO