Seafood market data by API
Verified seafood data, delivered two ways.
Curated supply, demand, and pricing tables for every species you trade. Pull them by API, or ask the ANNA AI assistant in plain language.
Benchmark your own prices and volumes against the market.
The whole seafood market, in tables you can trust
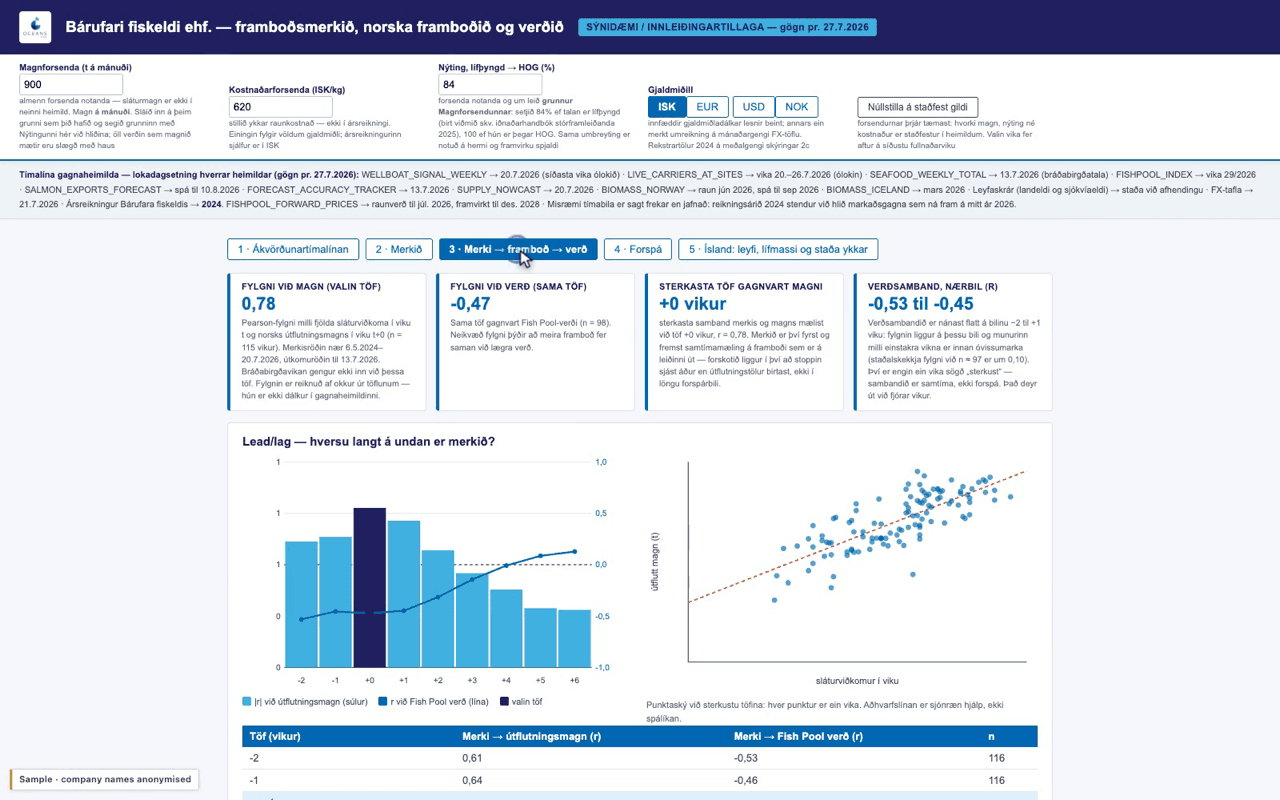
Oceans of Data sells direct access to verified seafood supply, demand, and pricing datasets: the numbers that are otherwise spread across public registries, third-party providers, broker calls and spreadsheets, in different formats, at different quality, and never joined. Built for the seafood industry by people from it.
- Real-time well-boat movements across Norwegian salmon farming: supply signals before they show up in the price.
- Verified tables, not guesswork. Every number is checked before it reaches you.
- Five years of proprietary joined data, not a snapshot.
- For everyone who buys and sells fish: traders, producers, and integrated companies alike.
Worked example
What a week of timing is worth
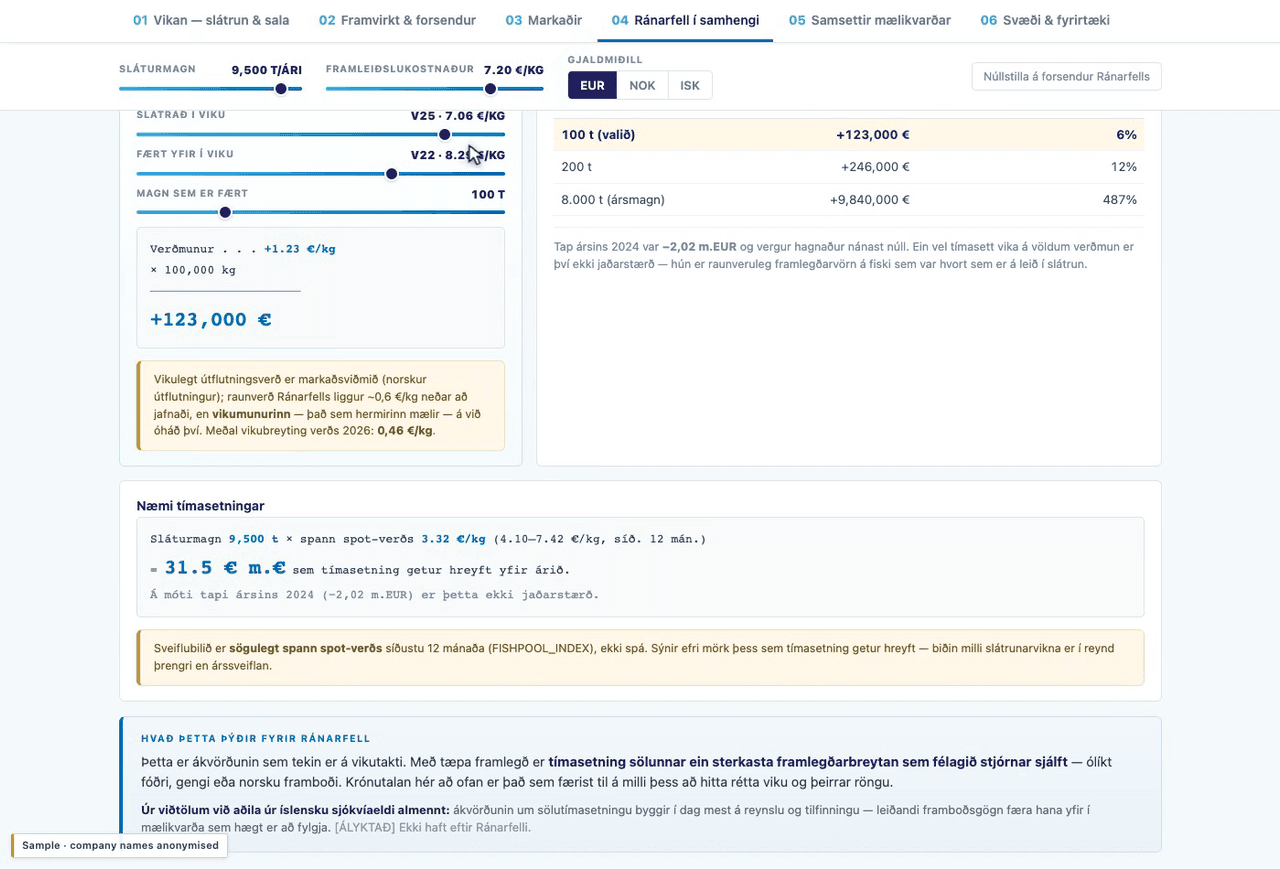
Slaughter-timing optimisation
Move a harvest between two forward windows and the price moves with it. Put your volume against the forward curve and the difference shows up in euros per kilo before you commit the fish. On 2,500 tonnes, a 0.32 EUR/kg level difference is worth 800,000 EUR.
The market today
Seafood decisions still run on broker calls and spreadsheets
The supply, demand, and price data you need to trade is fragmented, slow, and hard to verify.
Fragmented and opaque
The numbers you need sit in public registries, third-party feeds, broker calls and spreadsheets, in different formats and different quality, never joined. So you price on part of the picture.
Slow and informal
Signals arrive by phone, one call at a time. The chain is long, and by the time you hear it the market has already moved.
No way to see where you stand
You cannot compare your own prices and volumes against the wider market, so you never know how much is being sold around you, or whether you have anything to point to when a buyer questions your price.
How access works
From request to data in three steps
Three steps from first conversation to data in your own systems.
Request access
Tell us the species and regions you trade. We confirm coverage and set up access to the exact tables you need.
See supply, demand, and prices
Verified market data across species in one place, with predictive metrics, so you act on where the market is going, not just where it has been.
Decide and benchmark
Compare your own prices and volumes against the wider market, and move before competitors do.
How you access the data
Get the same verified data, whichever way your team works
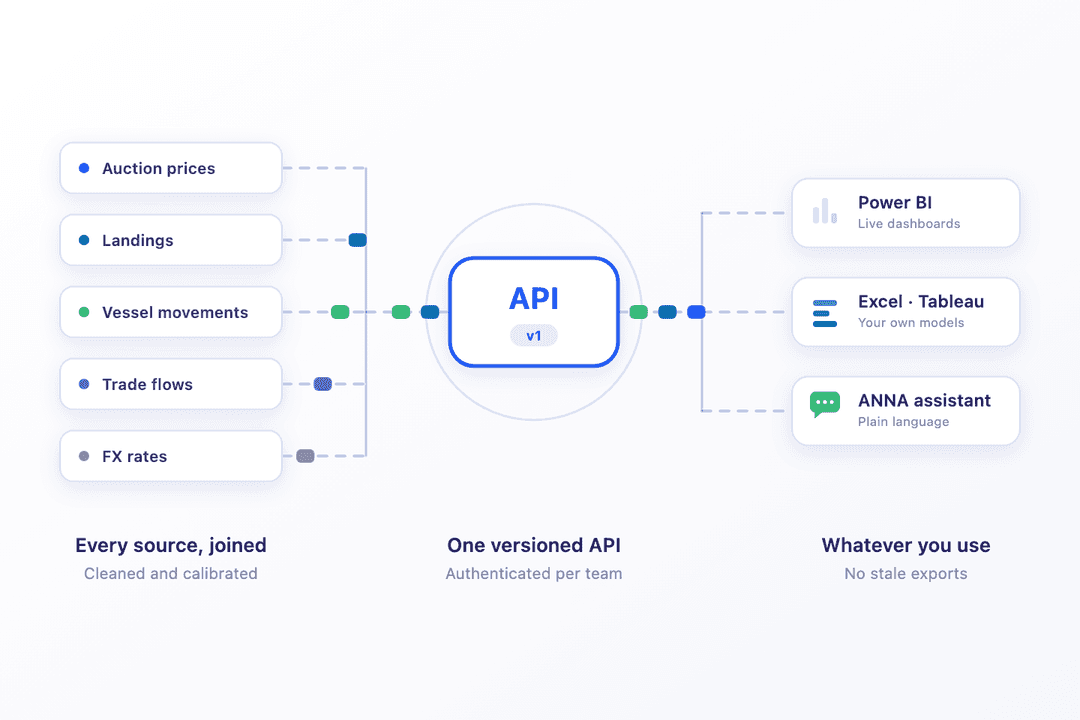
API
Raw verified tables piped straight into Power BI or your own systems, so your team builds live dashboards and reports on current market data instead of stale exports.
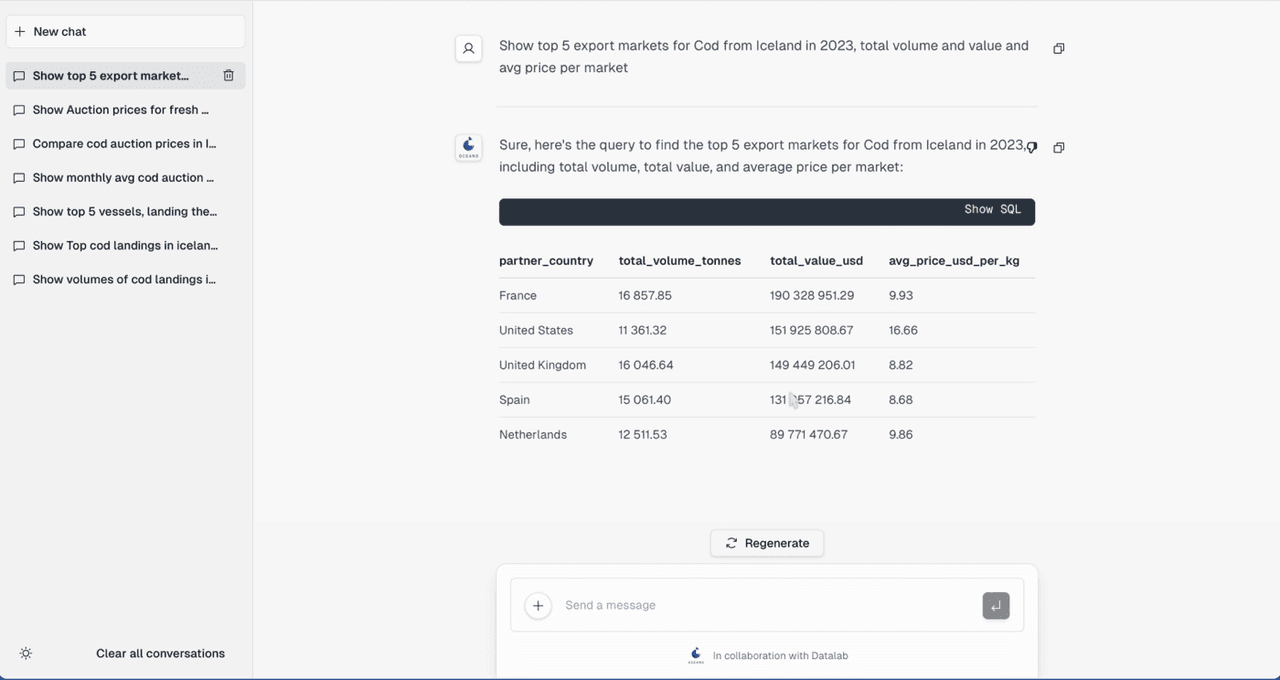
ANNA (AI assistant)
Ask in plain language and get the answer back with no queries to write. Built for sales and production teams.
Market coverage
Verified coverage across the North Atlantic, Nordics, and Europe, scaling globally.
Built for the people who buy and sell fish, throughout the whole value chain
Two ways to work with the same verified data.
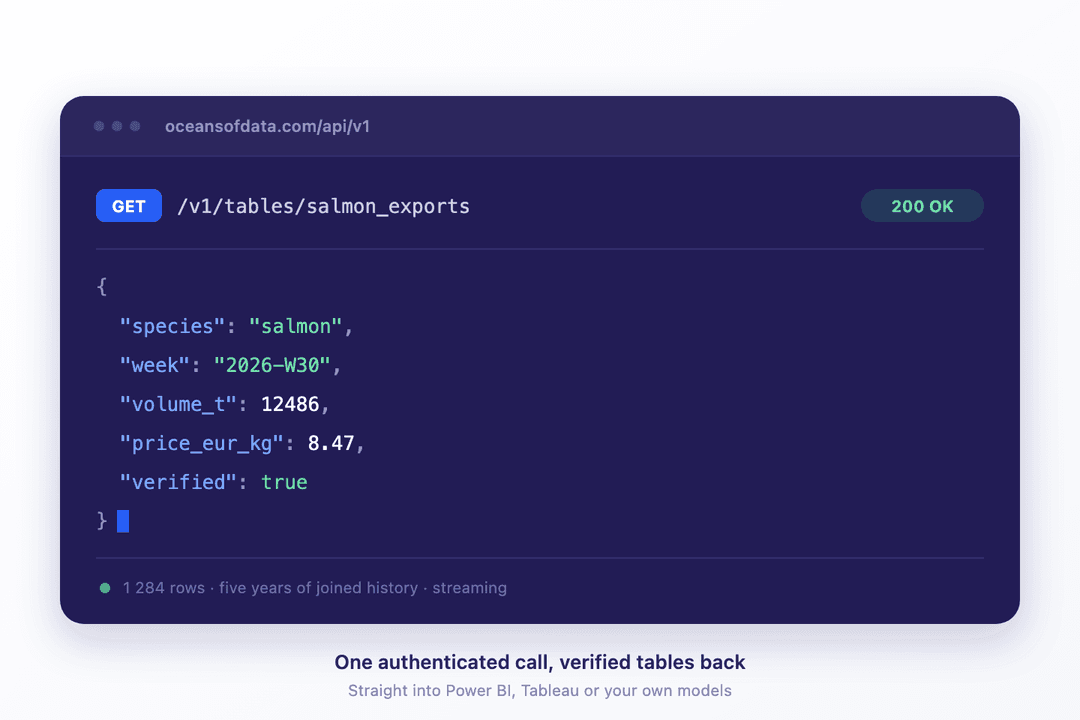
For the teams who build
Data and BI teams who wire the feed into their own stack.
- Pull raw verified tables via API into Power BI or your own stack
- Predictive supply and demand metrics
- No stale exports
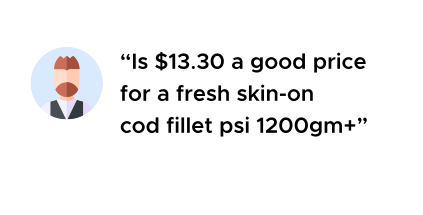
For the teams who buy and sell
Sales and purchasing managers, production planners, business development and management: anyone who needs the numbers without writing queries.
- Ask ANNA in plain language
- Benchmark your prices against the wider market
- No queries to write
Why Oceans of Data
Purpose-built for seafood, not a generic data tool
By people from the seafood industry
Our founder grew up in it: a family business that went from fishing to saltfish production and became Iceland's largest saltfish exporter. She has worked the factory floor and the operational office, and has built market data and analysis for seafood since 2015. The engineering team behind Oceans of Data comes from DataLab, specialising in data science and AI.
Five years of joined data
We have been collecting, cleaning and joining seafood market data since 2021. That history is the part nobody can rebuild overnight.
Predictive, not just historical
Forward-looking supply and demand metrics, so you plan ahead instead of reacting to last week's prices.
One verified source across species
Supply, demand, and pricing unified and checked, versus broker calls and scattered spreadsheets you cannot audit.
Common questions
We collect from public registries, third-party providers and direct sources, then clean, join and calibrate every table before it reaches you. Five years of joined history sits behind the numbers, so you can see how a figure has moved and not just where it sits today.
An index gives you one number for one species. A broker gives you one view of one part of the market. We deliver the underlying data across wild and farmed species, straight into your own systems: supply, biomass, vessel movements, landings, auction and raw-material prices, trade flows and FX. You build your own view.
Salmon, cod, mackerel, haddock, saithe, and more, focused on the North Atlantic, Nordics, and Europe today and scaling globally. Tables range from real-time well-boat movements and landings to auction prices and the OceansEX Cod Index. We'll confirm coverage before you commit.
By API, straight into Power BI, Tableau or your own systems. These are large tables, millions of rows across years of history, so they belong in the tools built to hold them rather than in a spreadsheet. Teams who prefer plain language use the ANNA assistant instead: the same verified data, whichever way you work.
Onboarding is done for you. We set up access for your team to the exact tables you need. There is no self-serve signup.
Tiered subscriptions starting at $195/month, with premium add-on tables. See the pricing page for the full breakdown.

Get started
See the seafood market clearly
Tell us the species and regions you trade, and we'll map it to the tables we already run.