
A Flat US Salmon Market Is Hiding a Shift in Origin
Fresh fillet imports fell 1.1%, but the Faroe Islands became the second largest volume gainer as Norwegian shipments declined.
What the Chart Shows
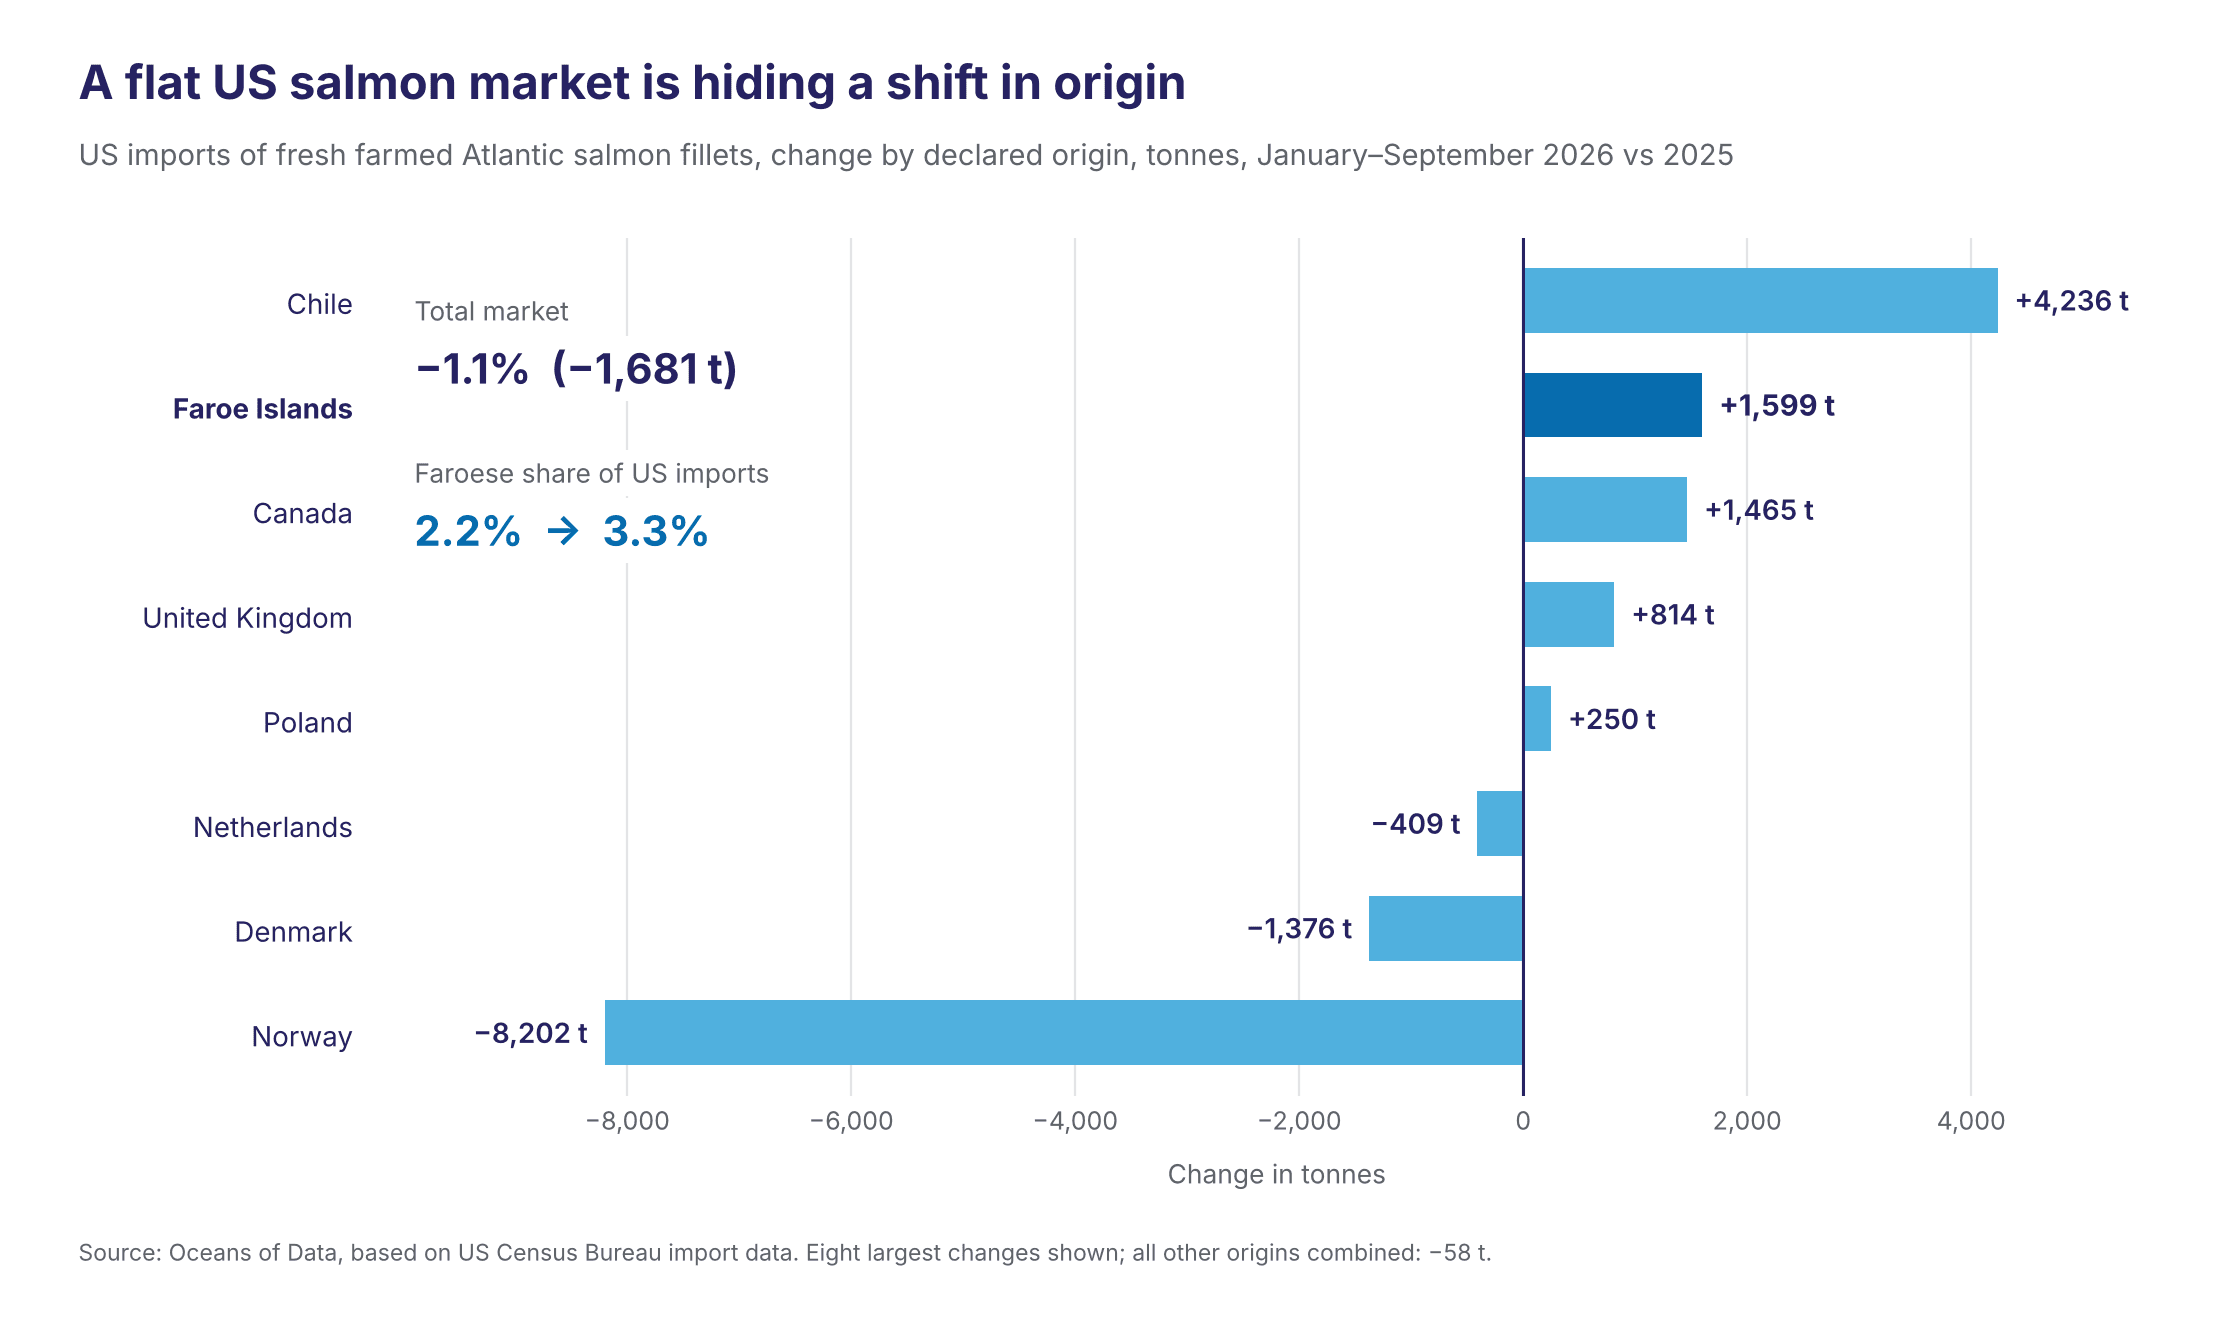
US imports of fresh Atlantic salmon fillets were almost unchanged in January to September, falling 1.1% to 148,730 tonnes.
Behind that flat total, the origin mix shifted. Chile recorded the largest increase, adding 4,236 tonnes. The Faroe Islands came next, adding 1,599 tonnes, followed by Canada with 1,465 tonnes. Norwegian shipments fell by 8,202 tonnes.
Faroese volume increased 47.8%, from 3,343 to 4,943 tonnes. Its share of US imports rose from 2.2% to 3.3%.
Why It Matters
This is a clear share gain in a market that did not expand.
When the overall market is flat, growth has to come from winning a larger share of existing demand. That is what makes the Faroese increase notable.
The entry pattern also broadened. Portland volume edged lower, while all other ports combined added 1,705 tonnes, pointing to a wider US logistics footprint for Faroese fillets.
What to Watch
The next question is whether the Faroese share gain holds into the fourth quarter.
The January to September average unit value was $11.56/kg, 2.0% above last year. That increase comes entirely from September. Through August the average was $11.21/kg, 2.7% below last year, before September unit value reached $14.18/kg. One strong month can lift the year-to-date average, but it does not establish a new price trend.
Is this the start of a more durable Faroese position in the US fresh fillet market, or a one-year shift in origin mix?
Source: Oceans of Data, based on US Census Bureau import data.
Anna Björk Theodórsdóttir
Founder & CEO